(i) By taking polling results on x-axis and seats won as y-axis and choosing an appropriate scale (1 unit = 10 seats for y-axis), the required graph of the above information can be constructed as follows.
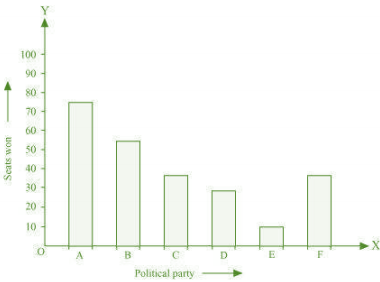
Here, the rectangle bars are of the same length and have equal spacing in between them.
(ii)Political party ‘A’ won maximum number of seats.
