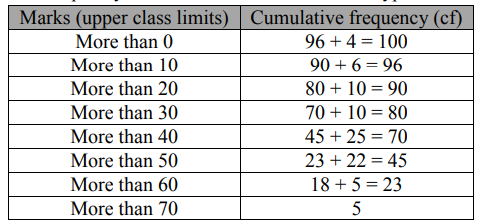
Draw a ‘more than’ ogive for the data given below which gives the marks of 100 students.
The frequency distribution table of more than type is as follows:
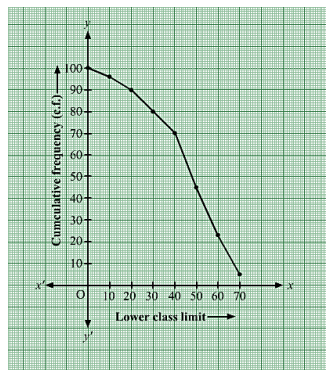
Taking lower class limits of on x-axis and their respective cumulative frequencies on y-axis, its ogive can be drawn as follows: