In a survey of 300 families of a colony, the number of **** in each family was recorded and the data has been represented by the bar graph, given below :
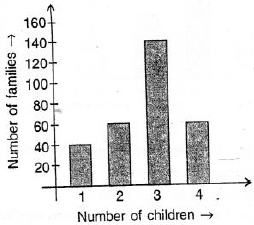
Read the graph carefully and answer the following questions :
(i) How many families have 2 **** each ?
(ii) How many families have no child ?
(iii) What percentage of families have 4 **** ?
