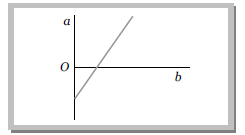
The expansion of unit mass of a perfect gas at constant pressure is shown in the diagram. Here
(a) a = volume, b = °C temperature
(b) a = volume, b = K temperature
(c) a = °C temperature, b = volume
(d) a = K temperature, b = volume
Correct option (c) a = °C temperature, b = volume
Explanation:
In the given graph line have a positive slop with X-axis and negative intercept on Y-axis.
So we can write the equation of line y = mx – c ...... (i)
By comparing (i) and (ii) we can say that time is represented on Y-axis and volume in X-axis.