+2 votes
in Mathematics by kratos

A rectangular zinc specimen is subjected to a tensile test and the data from the test is shown below. Width of specimen 40 mm; breadth of specimen 2.5 mm; gauge length 120 mm.

| Load (kN | 10 | 17 | 25 | 30 | 35 | 37.5 | 38.5 | 37 | 34 | 32 |
| Extension (mm) | 0.15 | 0.25 | 0.35 | 0.55 | 1.00 | 1.50 | 2.50 | 3.50 | 4.50 | 5.00 |

Fracture occurs when the extension is 5.0 mm and the maximum load recorded is 38.5 kN. Plot the load/extension graph and hence determine

(a) the stress at the limit of proportionality,

(b) Young’* modulus of elasticity,

(c) the ultimate tensile strength,

(d) the percentage elongation,

(e) the stress at a strain of 0.01,

(f) the extension at a stress of 200 MPa.

1 Answer

+6 votes
by kratos
 
Best answer

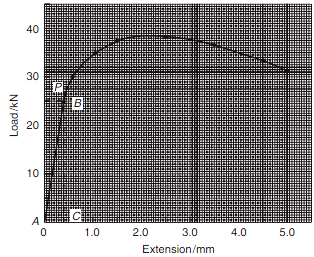
A load/extension graph is shown in Figure.

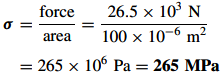
(a) The limit of proportionality occurs at point P on the graph, where the initial gradient of the graph starts to change. This point has a load value of 26.5 kN.

Cross-sectional area of specimen

40 mm × 2.5 mm = 100 mm2

100 × 10−6 m2

Stress at the limit of proportionality is given by:

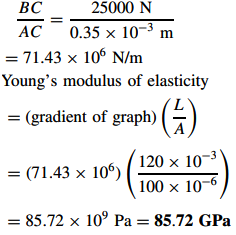
(b) Gradient of straight line portion of graph is given by:

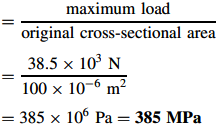
(c) Ultimate tensile strength

(d) Percentage elongation

From the graph, the load corresponding to an extension of 1.20 mm is 36 kN. Stress at a strain of 0.01 is given by:

(f) When the stress is 200 MPa, then

force = area × stress

= (100 × 10−6 )(200 × 106)

= 20 kN

From the graph, the corresponding extension is 0.30 mm.

...