The relation between stress and strain is generally shown by plotting a stress-strain (σ-e) diagram. Stress is plotted on ordinate (vertical axis) and strain on abscissa (horizontal axis). Such diagrams are most common in strength of materials for understanding the behaviour of materials. Stress-strain diagrams are drawn for different loadings. Therefore they are called
- Tensile stress-strain diagram
- Compressive stress-strain diagram
- Shear stress-strain. diagram
Stress-Strain Curves (Tension)
When a bar or specimen is subjected to a gradually increasing axial tensile load, the stresses and strains can be found out for number of loading conditions and a curve is plotted upto the point at which the specimen fails. giving what is known as stress-strain curve. Such curves differ in shape for various materials. Broadly speaking the curves can be divided into two categories.
(a) Stress-strain carves for ductile materials: A material is said to be ductile in nature, if it elongates appreciably before fracture. One such material is mild steel. The shape of stress-strain diagram for the mild steel is shown in Fig.(a)
A mild steel specimen of either circular cross-section (rod) or rectangular section (flat bar) is pulled until it breaks. The extensions of the bar are measured at every load increments. The stresses are calculated based on the original cross sectional area and strains by dividing the extensions by gauge length. When the specimen of a mild steel is loaded gradually in tension, increasing tensile load, in tension testing machine. The initial portion from O to A is linear where strain linearly varies with stress. The line is called line of proportionality and is known as proportionality limit. The stress corresponding to the point is called “Limit of Proportionality”. ***' law obeys in this part, the slope of the line gives, 'modulus of elasticity'.
Further increase in load increases extension rapidly and the stress- strain diagram becomes curved. At B, the material reaches its 'elastic limit' indicating the end of the elastic zone and entry into plastic zone. In most cases A and B coincide. if load is removed the material returns to its original dimensions.
Beyond the elastic limit, the material enters into the plastic zone and removal of load does not return the specimen to its original dimensions, thus subjecting the specimen to permanent deformation. On further loading the curve reaches the point $C' called the upper yield point at which sudden extension takes place which is known as ductile extension where the strain increases at constant stress. This is identified by the horizontal portion of the diagram. Point C gives 'yield stress'. beyond which the load decreases with increase in strain upto C' known as lower yield point.
After the lower yield point has been crossed, the stress again starts increasing, till the stress reaches the maximum value at point $D'. The increase in load causes non linear extension upto point D. The point D known as 'ultimate point' or 'maximum point'. This point gives the 'ultimate strength' or maximum load of the bar. The stress corresponding to this highest point $D' of the stress strain diagram is called the ultimate stress.
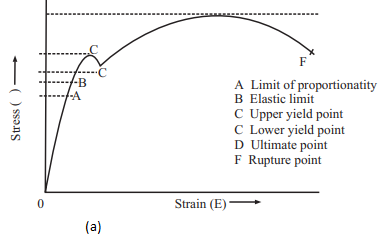
After reaching the point D, if the bar is strained further, a local reduction in the cross section occurs in the gauge length (i.e., formation of neck). At this neck stress increases with decrease in area at constant load, till *** take place. Point F is called 'rupture point.Note that all stresses are based on original area of cross section in drawing the curve,
- Yield strength = Load at yield point/A0
where (original area ) A0 = π/A0 D02
Ultimate strength = Ultimate load/A0=P max/A0
% Elongation = LF -L0/L0 x 100
where LF = Final length of specimen
L0 = Original length of specimen
- % Reduction in area AF -A0/A0 x 100
where AF = Final area of cross section
A0 = Original area of cross section
- Young’* modulus of elasticity, E = Stress at any point with in elastic limit/Strain at that point
From the figure clastic limit is upto point B
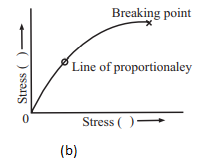
(b) Stress strain curves for brittle materials :
Materials which show very small elongation before they fracture are called brittle materials. The shape of curve for a high carbon steel is shown in Fig.(b) and is typical of many brittle materials such as G.I, concrete and high strength light alloys. For most brittle materials the permanent elongation (i.e., increase in length) is less than 10%.
Stress-Strain Curves (Compression)
For ductile materials stress strain curves in compression are identical to those in tension at least upto the yield point for all practical purposes. Since tests in tension are simple to make, the results derived from tensile curves are relied upon for ductile materials in compression. Brittle materials have compression stress strain curves usually of the same form as the tension test but the stresses at various points (Limit of proportionality, ultimate etc) are generally considerably different.