Short Term Equilibrium tells the Actual Condition of the Economy. Actual GDP *** close to Potential GDP. The Aggregate Demand (AD) – Aggregate Supply (AS) Model informs as to how are the Monetary and Fiscal Policies become Effective .
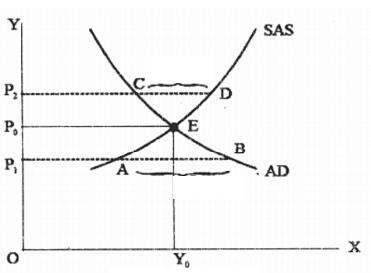
When the Aggregate Demand (AD) is Equal to Short Term Supply Curve ( SAS) , the Equilibrium is at E , where Income OY0 and Price Level P0 are Determined . If the Price is P2, the Aggregate Supply is Comparatively More than Aggregate Demand which is called Minimum Demand (CD) . In such a situation , the Producer cuts down the Production . As the Demand is Less, the Produced Goods cannot be Sold and these Goods are Stored as Stock. The Costs begins to go Down and Again attain the Equilibrium Price P.
Opposed to this , if the Prices are OP1, then the Aggregate Demand is Comparatively More than Aggregate Demand which is called Predominant Demand (AB) . More Demand Encourages More Production. As the Producers Demand more means of Production , it leads to an Increment in Investment. Finally , the Price of Goods begins to Increase and Equilibrium P0 is again Attained in the Prices. In the Short Term , Monetary Wage Level is Stable and Actual GDP may be More or Less than Potential GDP. In the Long Term , Equilibrium is Attained when Aggregate Demand is Equal to Long Term Aggregate Supply Curve . The Long Term Supply Curve GDP is Vertical and so is Equal to Potential GDP in the Long Term, Actual GDP is Equal to Potential GDP
