We know that, over is an independent variable and run is a dependent variable. So, we take overs on x-axis and runs on the y-axis.
By choosing the following scale:
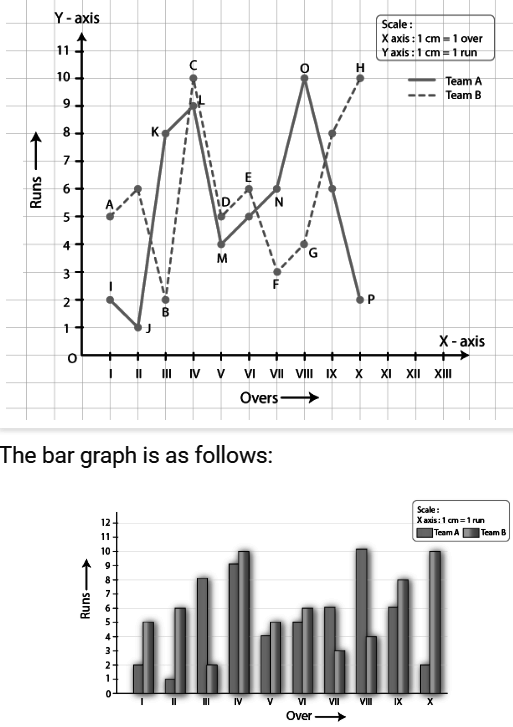
On x-axis: 1 cm = 1 over
On y-axis: 1 cm = 1 run
Now, let us plot (I, 2), (II, 1), (III, 8)… (X, 2) for team A and (I, 5), (II, 6), (III, 8) ….. (X, 10) for team B.
These points are joined to get the graph representing the given information as shown in the figure below.